Performance Profiling in EK9
EK9's test runner includes built-in performance profiling.
Append p to any test format flag to enable profiling alongside test execution
and coverage collection.
- Enabling Profiling - The
psuffix - What Profiling Measures - Counts, timing, percentiles
- Output Formats - Human, JSON, HTML
- Interpreting the Flame Graph - Reading the visualization
- Reading the Hot Function Table - Column guide
- Profiling Badges in Source Views - Per-function performance data
Enabling Profiling
Append p to any test format flag:
ek9 -tp main.ek9        # Human-readable output with profiling summary
ek9 -t2p main.ek9       # JSON output with profiling data (for AI/tool analysis)
ek9 -t5p main.ek9       # Verbose coverage + profiling
ek9 -t6p main.ek9       # Full HTML report with flame graph and hot function table
Profiling is additive - it does not replace coverage or test results. All three datasets (test results, coverage, profiling) are collected simultaneously and appear in the appropriate output format.
What Profiling Measures
Profiling records call counts and wall-clock timing (nanosecond precision) for every function and method executed during test runs:
- Call Count - How many times each function/method was invoked
- Total Time - Wall-clock time including calls to other functions
- Self Time - Time spent in the function itself, excluding callees
- Average Time - Total time divided by call count
- Min / Max Time - Fastest and slowest individual invocation
- Percentiles (p50, p95, p99) - Distribution of invocation times. p50 is the median call time, p95 is the 95th percentile (only 5% of calls are slower), and p99 captures tail latency
Percentile metrics are especially valuable for identifying latency outliers. A function with low average time but high p99 indicates occasional slow calls that could impact user experience or SLA compliance.
Internal implementation methods (those starting with _) are excluded from
profiling output, as they are not visible to EK9 developers and would add noise.
Output Formats
Human Format (-tp or -t1p)
Appends a profiling summary after the test results:
Summary: 3 passed, 0 failed (3 total)

Profiling Summary:
  Total functions profiled: 8
  Top functions by total time:
    processOrder       12 calls   45.2ms total   12.1ms self   p50: 3.2ms  p99: 8.5ms
    validateInput       6 calls   28.7ms total   28.7ms self   p50: 4.2ms  p99: 6.1ms
    formatOutput       12 calls   15.3ms total    8.4ms self   p50: 1.1ms  p99: 2.3ms
JSON Format (-t2p)
Adds a profiling section to the JSON output:
{
  "summary": { ... },
  "tests": [ ... ],
  "coverage": { ... },
  "profiling": {
    "hotFunctions": [
      {
        "name": "processOrder",
        "module": "myapp.core",
        "callCount": 12,
        "totalNanos": 45200000,
        "selfNanos": 12100000,
        "avgNanos": 3766666,
        "minNanos": 1200000,
        "maxNanos": 8500000,
        "p50Nanos": 3200000,
        "p95Nanos": 7800000,
        "p99Nanos": 8500000
      }
    ],
    "flameGraph": [ ... ]
  }
}
The JSON format is ideal for automated analysis, CI/CD trend tracking, and AI-assisted performance optimization. Percentile fields enable latency SLA monitoring.
HTML Format (-t6p)
Generates the full interactive HTML report with additional profiling sections:
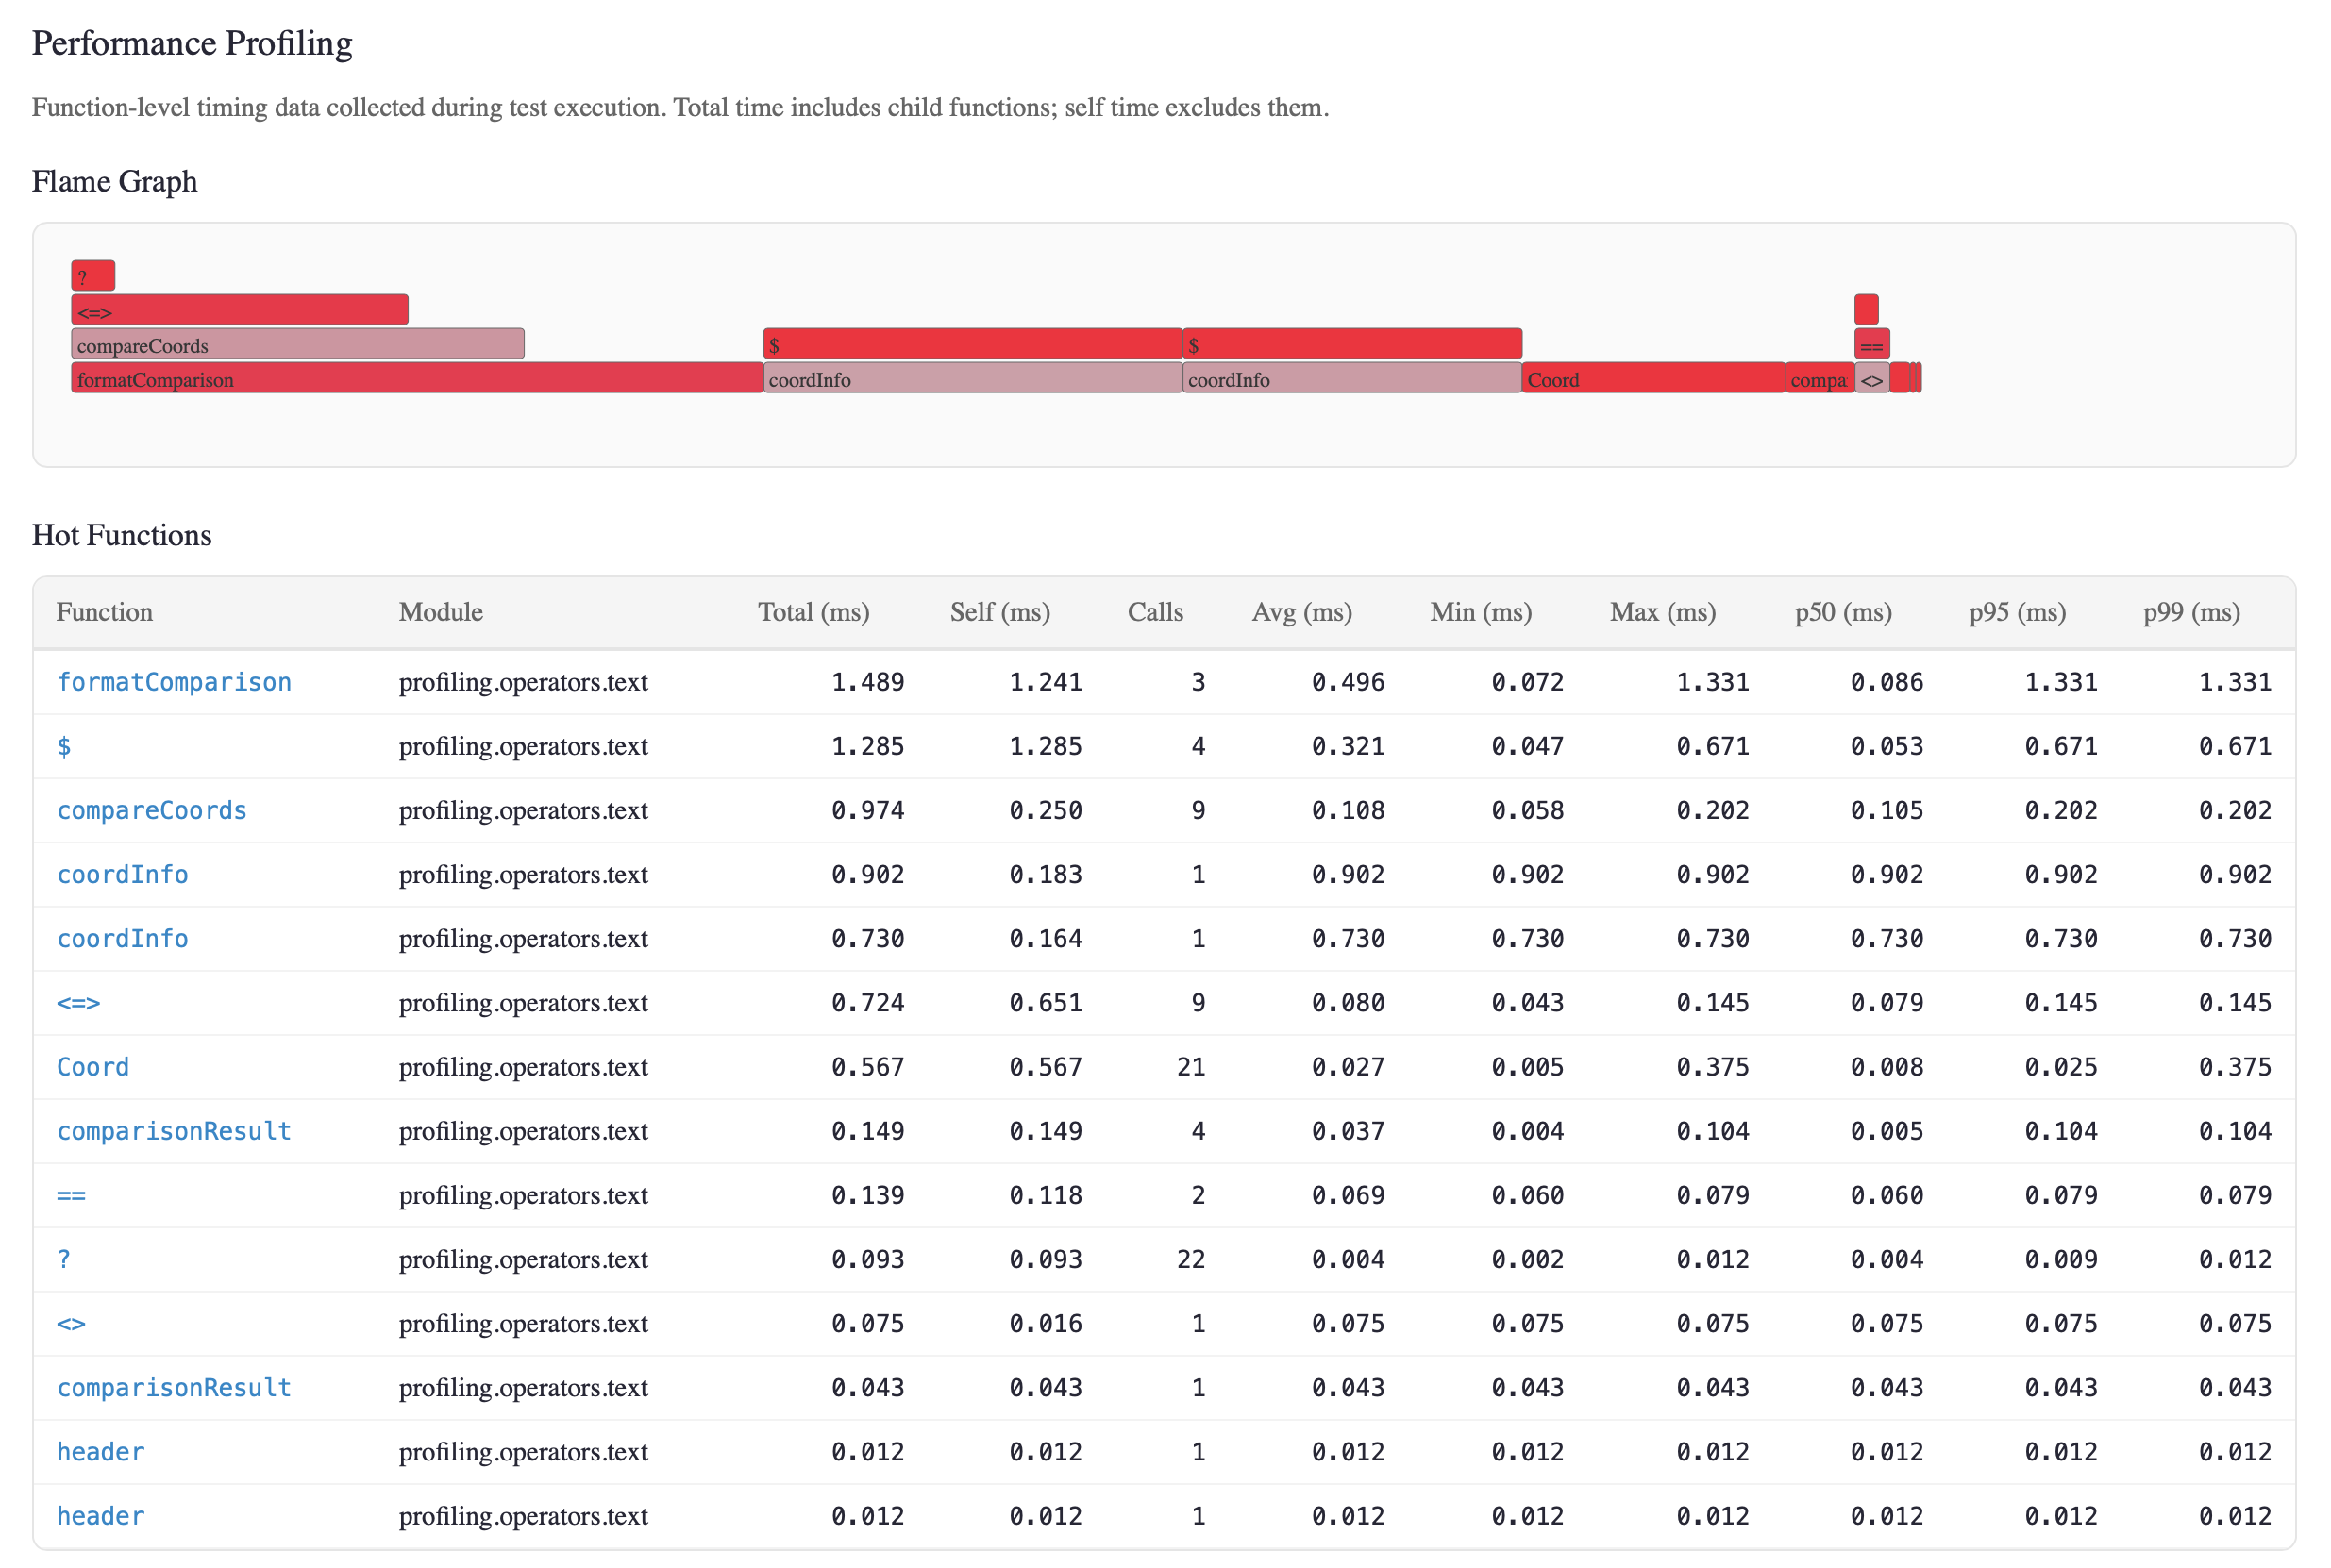
- Flame Graph - SVG visualization of the call hierarchy. Width represents execution time. Hover for detailed timing. Colors indicate self-time ratio.
- Hot Function Table - Table of the top 25 profiled functions ranked by total execution time.
- Profiling Badges in Source View - Each function shows call count and average time alongside the complexity badge.
Interpreting the Flame Graph
The flame graph is read bottom-up:
- Bottom row - Entry point functions (test programs, main functions)
- Higher rows - Functions called by the row below
- Width - Proportional to total execution time (wider = more time)
- Color - Self-time ratio. Red frames spend most time in their own code (potential optimization targets). Blue frames spend most time calling other functions.
Look for wide red frames - these are functions that consume significant time in their own code and are the best candidates for optimization.
Look for wide blue frames at the bottom - these are orchestration functions that delegate work. The optimization opportunity is in their callees, not in themselves.
Reading the Hot Function Table
The hot function table provides statistical detail beyond the flame graph. The top 25 functions are shown, ranked by total execution time:
| Column | What It Tells You |
|---|---|
| Function | Fully qualified function or method name. |
| Module | The EK9 module containing this function. |
| Total (ms) | Wall-clock time including callees. High total with low self = orchestrator. |
| Self (ms) | Time in this function only. High self = optimization target. |
| Calls | Invocation count. High calls with low avg = hot loop body. |
| Avg (ms) | Mean time per call. Can be misleading if distribution is skewed. |
| Min / Max (ms) | Best and worst case. Large gap = inconsistent performance. |
| p50 (ms) | Median - typical call time. More representative than average. |
| p95 (ms) | 95th percentile - experienced by 1 in 20 calls. Key SLA metric. |
| p99 (ms) | Tail latency - worst 1% of calls. Critical for user-facing code. |
Optimization strategy: Sort by Self (ms) to find functions where time is
actually spent. Sort by p99 to find latency outliers. A function with
avg=0.5ms but p99=50ms has an intermittent performance problem
that averages hide.
Profiling Badges in Source Views
When viewing source code in the HTML report, each function shows a profiling badge alongside its complexity badge:
processOrder()      CC:3 12× 3.77ms
  -> order as Order
  <- result as OrderResult
  ...
The badge shows call-count× avg-time. Hover over the badge to see the
full performance profile:
Performance Profile

Calls: 12
Total: 45.200ms | Self: 12.100ms
Avg: 3.767ms | Min: 1.200ms | Max: 8.500ms
p50: 3.200ms | p95: 7.800ms | p99: 8.500ms
This gives you a complete picture at a glance: which code runs, how often, and how fast - combined with coverage and complexity data on the same page.
See Also
- Testing - Test types, assertions, test runner commands
- Code Coverage - Threshold enforcement, quality metrics, HTML reports
- Compiler Fuzzing - Grammar-based fuzzer with error code coverage dashboard
- Test Generation - Automated edge-case test generation and mutation testing
- Command Line - All flags and exit codes
- For AI Assistants - Machine-readable JSON profiling schema